Ellipse
Overview
Concrete Class
An ellipse.
Supertypes
Members
Data Properties
Name |
Multiplicity |
Type |
Ordered |
Unique |
|
|---|---|---|---|---|---|
1 |
no |
no |
The center position of the Ellipse. |
||
1 |
no |
no |
The fill style of the Ellipse. |
||
1 |
no |
no |
The length of the horizontal semi-axis of the Ellipse in mm. |
||
1 |
no |
no |
The rotation of the Ellipse around its center, measured clockwise and in degrees. The value must be in the inverval [0; 360). |
||
1 |
no |
no |
The stroke of the Ellipse. |
||
1 |
no |
no |
The length of the vertical semi-axis of the Ellipse in mm. |
Geometry
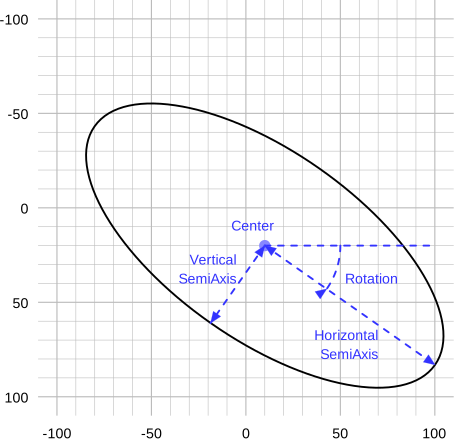
The geometry of an Ellipse is characterized by its Center, its two axes (HorizontalSemiAxis and VerticalSemiAxis), and the Rotation of the HorizontalSemiAxis w.r.t. the x axis of the owner. The Rotation is measured clockwise and in degrees.
Example
We consider an Ellipse with
Center
(10, 20),HorizontalSemiAxis
110,VerticalSemiAxis
50, andRotation
35.
The Ellipse will look like this:
Visual Center
The visual center of an Ellipse is its actual Center.
Mapping to SVG
An Ellipse corresponds to an svg:ellipse with these attributes:
transformdescribes both the Center \((c_x, c_y)\) and the Rotation \(r\) of the Ellipse.transform = "translate(+ str(\(c_x\)) +,+ str(\(c_y\)) +) rotate(+ str(\(r\)) +)"rxandryare string representations of HorizontalSemiAxis and VerticalSemiAxis.stroke,stroke-dasharray,stroke-dashoffsetandstroke-widthare set according to the SVG mapping rules for the Stroke of the Ellipse (see Stroke).stroke-linecap = "round"andstroke-linejoin = "round"reflect the heuristic for line caps and line joins.vector-effect = "non-scaling-stroke"reflects the heuristic for scaled symbols.fillis set according to the SVG mapping rules for the FillStyle of the Ellipse (see FillStyle).
Example
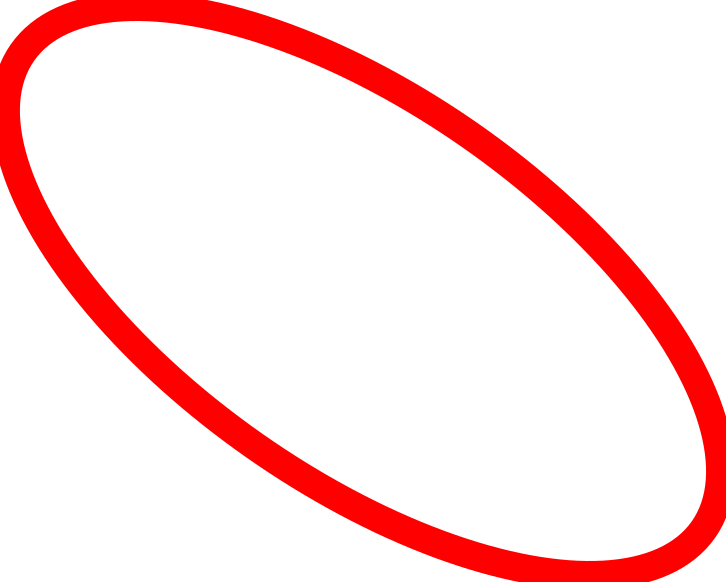
We assume that the Stroke of the Ellipse above is
2mm #ff0000 Solid and that its FillStyle is
Transparent.
{EllipseTransparentSvgCode}

Center
Data Property
The center position of the Ellipse.
Type: Point
Multiplicity: 1
Ordered: no
Unique: no
Example
X = 0.0,
Y = 0.0)
FillStyle
Data Property
The fill style of the Ellipse.
Type: FillStyle
Multiplicity: 1
Ordered: no
Unique: no
Example
HorizontalSemiAxis
Data Property
The length of the horizontal semi-axis of the Ellipse in mm.
Type: Double
Multiplicity: 1
Ordered: no
Unique: no
Example
7.5
Rotation
Data Property
The rotation of the Ellipse around its center, measured clockwise and in degrees. The value must be in the inverval [0; 360).
Type: Double
Multiplicity: 1
Ordered: no
Unique: no
Example
270.0
Stroke
Data Property
The stroke of the Ellipse.
Type: Stroke
Multiplicity: 1
Ordered: no
Unique: no
Example
B = 0,
G = 0,
R = 128),
Width = 0.3)
VerticalSemiAxis
Data Property
The length of the vertical semi-axis of the Ellipse in mm.
Type: Double
Multiplicity: 1
Ordered: no
Unique: no
Example
7.5
Example in DEXPI XML
<Object type="Core/Diagram.Ellipse">
  <Data property="Center">
    <AggregatedDataValue type="Core/Diagram.Point">
      <Data property="X">
        <Double>0.0</Double>
      </Data>
      <Data property="Y">
        <Double>0.0</Double>
      </Data>
    </AggregatedDataValue>
  </Data>
  <Data property="FillStyle">
    <DataReference data="Core/Diagram.FillStyle.Transparent"/>
  </Data>
  <Data property="HorizontalSemiAxis">
    <Double>7.5</Double>
  </Data>
  <Data property="Rotation">
    <Double>270.0</Double>
  </Data>
  <Data property="Stroke">
    <AggregatedDataValue type="Core/Diagram.Stroke">
      <Data property="Color">
        <AggregatedDataValue type="Core/Diagram.Color">
          <Data property="B">
            <Integer>0</Integer>
          </Data>
          <Data property="G">
            <Integer>0</Integer>
          </Data>
          <Data property="R">
            <Integer>128</Integer>
          </Data>
        </AggregatedDataValue>
      </Data>
      <Data property="DashStyle">
        <DataReference data="Core/Diagram.DashStyle.Solid"/>
      </Data>
      <Data property="Width">
        <Double>0.3</Double>
      </Data>
    </AggregatedDataValue>
  </Data>
  <Data property="VerticalSemiAxis">
    <Double>7.5</Double>
  </Data>
</Object>