Diagram
Core::Diagram
Overview
Package
Two-dimensional engineering diagrams.
The Diagram package provides concepts
for the graphical representation of a ConceptualObject,
for linking parts of this graphical representation to parts of the ConceptualObject, and
for semantic annotations of the graphical representation.
Technical
This specification is not a drawing standard. It does not prescribe any drawing style or standard and it does not prescribe which information in a ConceptualObject has to be represented in a Diagram.
Technical
Until version 1.2, graphics has not been in the scope of the DEXPI P&ID Specification. Graphics was handled as prescribed by standard-proteus. Over the years, some best practices concerning graphics have evolved in the DEXPI community, and fragmentary annotations have been added to the DEXPI P&ID Specification.
In DEXPI P&ID Specification 1.3, an informative Graphics package was added to cover conceptual and graphics information in a single comprehensive model.
For the P&ID Specification 1.4, the Graphics package was further elaborated, and it is now a normative part of the specification. It serves to document the best practices that have emerged in the past, but no new features have been added.
The Graphics package is independent from Proteus Schema in the sense that it is a pure UML package. But, like for all other packages in this specification, mappings to Proteus Schema are defined that describe how instances of the package’s types are serialized. In consequence, the features of the Graphics package are constrained to what is supported by Proteus Schema. Future versions of the DEXPI P&ID Specification will skip support for Proteus Schema, such that additional features can be added to the Graphics package depending on the DEXPI community’s needs.
Since DEXPI 2.0, the Graphics package can be used for both P&IDs and process models.
Example
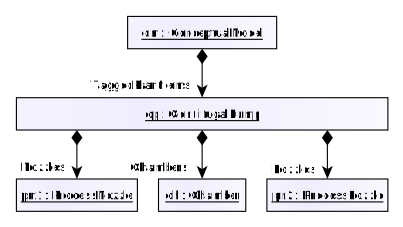
We consider a simple ConceptualModel cm that contains a single CentrifugalPump with two ProcessNozzles and a Chamber; in total, there are five ConceptualObjects:
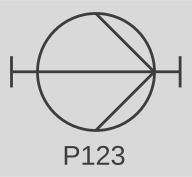
A typical graphical representation of this model may look like this:
Linking Graphics and Conceptual Objects
The graphics can be decomposed in parts each of which represents one of the ConceptualObjects. For each of these parts, we use a RepresentationGroup:
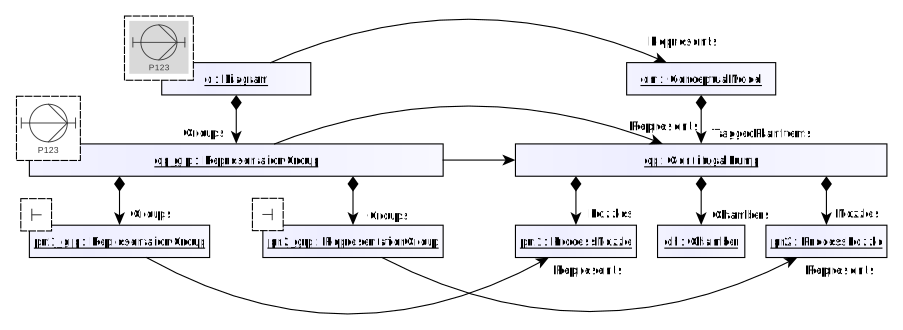
The Diagram d represents the entire ConceptualModel. Diagram is a subclass of RepresentationGroup that is meant to be used for the entire graphics. In addition to a conventional RepresentationGroup, a Diagram has a size (width and height) and a background color.
cp_grp is the RepresentationGroup for the CentrifugalPump cp.
pn1_grp and pn2_grp represent the two ProcessNozzles pn1 and pn2.
Note that the composition hierarchy of the Diagram corresponds exactly to the composition hierarchy of the ConceptualModel. In the ConceptualModel, pn1 is a component of cp, and in the Diagram, pn1_grp is a component of cp_grp.
However, if a ConceptualObject (including all its descendants) has no graphical representation at all, no RepresentationGroup is required: In the example above, there is no RepresentationGroup for the Chamber ch.
Adding Semantics
So far, we have decomposed the overall graphics in RepresentationGroups that correspond to certain ConceptualObjects. On a finer level of granularity, we can identify parts with different meanings. These meanings are covered by different subclasses of the abstract class RepresentationTypeGroup. In the example, two of these subclasses are used: Static and EquipmentTagNameLabel.
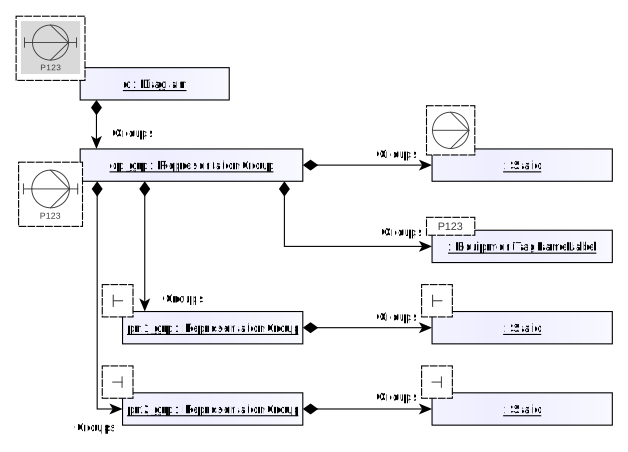
Consider cp_grp, the RepresentationGroup of the CentrifugalPump cp. In addition to the two groups for the ProcessNozzles, cp_grp now contains two RepresentationTypeGroups.
The Static group contains the actual CentrifugalPump graphics without any annotations, labels, etc.
The EquipmentTagNameLabel group displays the tag name of the CentrifugalPump.
pn1_grp contains a Static group for the basic symbol of the ProcessNozzle.
pn2_grp contains another Static group for the second ProcessNozzle symbol.
Whereas RepresentationGroups can be decomposed in further groups, RepresentationTypeGroups cannot contain further groups.
Adding Graphical Elements
RepresentationTypeGroups rather contain GraphicalElements such as geometric primitives, texts, or ShapeUsages.
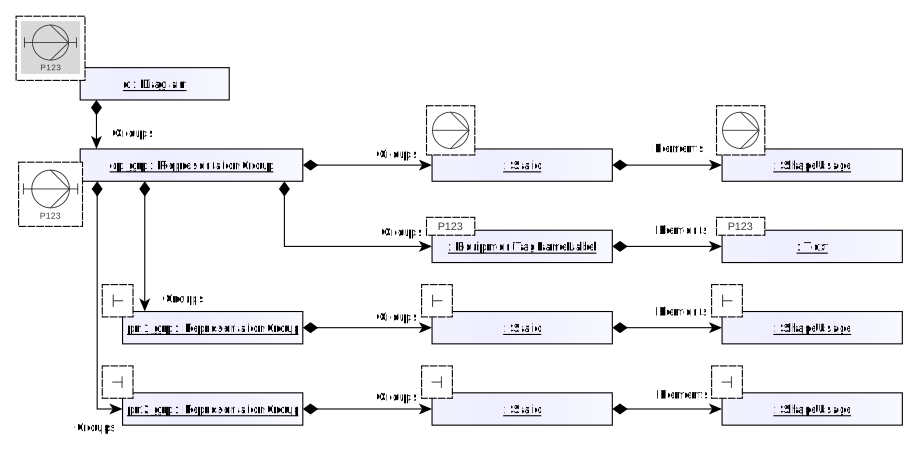
The Static group for the CentrifugalPump contains a ShapeUsage, i.e., a reference to a reusable Shape with information about this specific usage (scaling, rotation, position).
The EquipmentTagNameLabel for the CentrifugalPump contains a Text.
Both Static groups for the two ProcessNozzles contain a ShapeUsage.
Coordinate System
The coordinate system used is a 2D Cartesian system whose horizontal axis is oriented to the right and whose vertical axis is oriented to the bottom. In consequence, angles are measured clockwise.
Lengths are dimensionless. In the examples, we assume they are in millimeters.
In Proteus Schema, the vertical axis to the top, and angles are measured anti-clockwise.
Mapping to SVG
The purpose of these mappings is to define the visualization of instances of the types in this package, i.e., “how they look like”.
In order to keep the mappings simple, the SVG mappings for all
GraphicalPrimitives are defined such that
they can be easily scaled when they appear in a Shape (in particular, they use
vector-effect = "non-scaling-stroke"). In consequence, further scaling, e.g., in an
application, will lead to unacceptable results.
The SVG mappings in this specification must not be misunderstood as a proposal for exchanging P&ID graphics via SVG.
Modulo Operator
In some calculations for the SVG and Proteus mappings, the modulo operator (or remainder of division) is used. As the modulo operator can be defined in different ways, we give a definition of how the operator is used in this specification. We content ourselves with a definition for positive quotients.
Let \(q > 0, a \in \mathbb R\). Then
\(\lfloor.\rfloor\) is the floor function that for \(x \in \mathbb R\) yields the largest integer \(n\) such that \(n \leq x\).
For example,
Technical
The definition of the modulo operator differs between programming languages. For example, the modulo operator in Python, written %, coincides with the definition above. The modulo operator in JavaScript (ECMAScript), also written %, behaves differently for negative dividends: -100 % 360 is evaluated to -100.
Members
Classes
Name |
Type |
|
|---|---|---|
Concrete Class |
||
Concrete Class |
||
Concrete Class |
||
Concrete Class |
||
Concrete Class |
||
Concrete Class |
An ellipse. |
|
Concrete Class |
||
Abstract Class |
||
Abstract Class |
||
Abstract Class |
||
Concrete Class |
||
Concrete Class |
||
Concrete Class |
||
Concrete Class |
Meta data about a Core.Container. |
|
Abstract Class |
||
Concrete Class |
||
Concrete Class |
||
Concrete Class |
A curve that consists of one or more chained straight sections. |
|
Concrete Class |
A figure that is delimited by a closed chain of three or more straight sections. |
|
Concrete Class |
A RepresentationGroup is a graphical representation of a ConceptualObject. |
|
Abstract Class |
||
Concrete Class |
||
Concrete Class |
||
Concrete Class |
||
Concrete Class |
||
Concrete Class |
||
Concrete Class |
||
Concrete Class |
||
Abstract Class |
Data Types
Name |
Type |
|
|---|---|---|
Enumeration |
||
Aggregated Data Type |
A color. |
|
Enumeration |
||
Enumeration |
A DashStyle describes a pattern for drawing a stroke. The pattern gives the lengths of those parts of a stroke that are actually drawn and of those parts that are not drawn. |
|
Enumeration |
||
Aggregated Data Type |
A point in the X-Y-plane. |
|
Aggregated Data Type |
A stroke defines the visual appearance of a line. |
|
Enumeration |