PolyLine
Overview
Concrete Class
A curve that consists of one or more chained straight sections.
Supertypes
Members
Data Properties
Name |
Multiplicity |
Type |
Ordered |
Unique |
|
|---|---|---|---|---|---|
2..* |
yes |
no |
The points of the PolyLine. |
||
1 |
no |
no |
The stroke of the PolyLine. |
Geometry
The first straight section of a PolyLine starts at its first Point, i.e., Points[0], and ends at its second Point. For each further Point, another section is drawn that starts at the preceding Point.
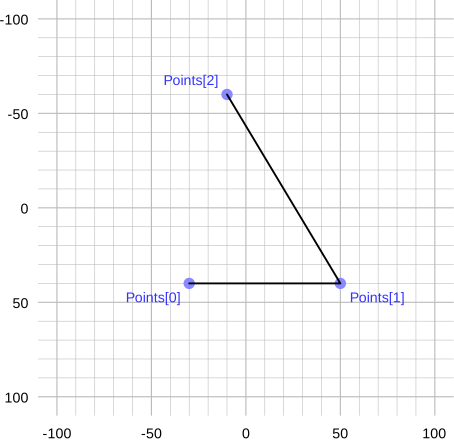
Mapping to SVG
A PolyLine corresponds to an svg:polyline with these attributes:
pointscontains the Points of the PolyLine.Each Point \(i\) with position \(x_i\) and \(y_i\) is converted to a string as str(\(x_i\)) +
,+ str(\(y_i\)). Finally, thepointsattribute is set to a single string that contains all positions, separated by spaces.stroke,stroke-dasharray,stroke-dashoffsetandstroke-widthare set according to the SVG mapping rules for the Stroke of the PolyLine (see Stroke).stroke-linecap = "round"andstroke-linejoin = "round"reflect the heuristic for line caps and line joins.vector-effect = "non-scaling-stroke"reflects the heuristic for scaled symbols.fill = "none"is required to avoid that the svg:polyline is filled.



Points
Data Property
The points of the PolyLine.
Type: Point
Multiplicity: 2..*
Ordered: yes
Unique: no
Example
[
X = 3.5,
Y = 5.5),
X = 5.5,
Y = 7.5)
]
Stroke
Data Property
The stroke of the PolyLine.
Type: Stroke
Multiplicity: 1
Ordered: no
Unique: no
Example
B = 0,
G = 0,
R = 128),
Width = 0.3)
Example in DEXPI XML
<Object type="Core/Diagram.PolyLine">
  <Data property="Points">
    <AggregatedDataValue type="Core/Diagram.Point">
      <Data property="X">
        <Double>3.5</Double>
      </Data>
      <Data property="Y">
        <Double>5.5</Double>
      </Data>
    </AggregatedDataValue>
    <AggregatedDataValue type="Core/Diagram.Point">
      <Data property="X">
        <Double>5.5</Double>
      </Data>
      <Data property="Y">
        <Double>7.5</Double>
      </Data>
    </AggregatedDataValue>
  </Data>
  <Data property="Stroke">
    <AggregatedDataValue type="Core/Diagram.Stroke">
      <Data property="Color">
        <AggregatedDataValue type="Core/Diagram.Color">
          <Data property="B">
            <Integer>0</Integer>
          </Data>
          <Data property="G">
            <Integer>0</Integer>
          </Data>
          <Data property="R">
            <Integer>128</Integer>
          </Data>
        </AggregatedDataValue>
      </Data>
      <Data property="DashStyle">
        <DataReference data="Core/Diagram.DashStyle.Solid"/>
      </Data>
      <Data property="Width">
        <Double>0.3</Double>
      </Data>
    </AggregatedDataValue>
  </Data>
</Object>