Polygon
Overview
Concrete Class
A figure that is delimited by a closed chain of three or more straight sections.
Supertypes
Members
Data Properties
Name |
Multiplicity |
Type |
Ordered |
Unique |
|
|---|---|---|---|---|---|
1 |
no |
no |
The fill style of the Polygon. |
||
3..* |
yes |
no |
The points (vertices) of the Polygon. |
||
1 |
no |
no |
The stroke of the Polygon. |
Geometry
The first straight section that delimits a Polygon starts at its first Point, i.e., Points[0], and ends at its second Point. For each further Point, another section is added that starts at the preceding Point. Finally, a section is added that starts at the last Point and goes back to the first Point such that the chain of sections is closed.
Example
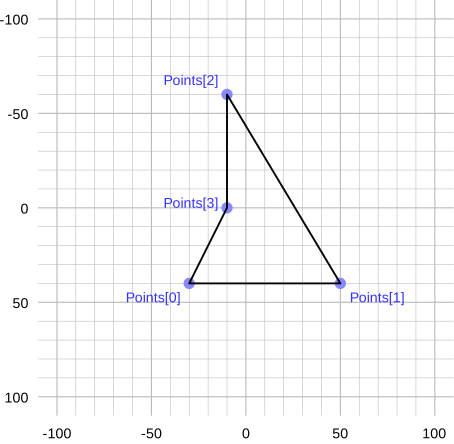
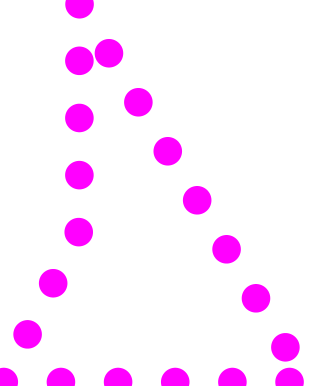
We consider a Polygon with 4 Points:
(-30, 40),(50, 40),(-10, -60), and(-10, 0).
The Polygon will look like this:
Interior of a Polygon
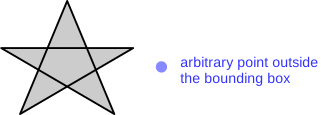
Depending on its FillStyle, the interior of a Polygon may be filled. There are several possibilities to define when “a point is inside a polygon”. DEXPI applies a simple intuitive rule:
Choose an arbitrary point outside the geometric bounding box of the Polygon.
Each point that can be reached from there without crossing any segment is outside the Polygon.
Each other point is inside the Polygon.
Technical
In case of polygons, the DEXPI definition for interior points coincides with the nonzero rule in SVG. See Section 13.4.2. of the SVG 2 Recommendation for a more precise definition of the nonzero rule.
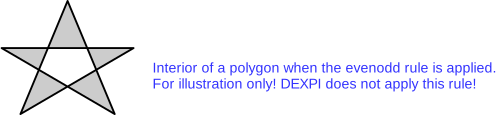
The SVG 2 Recommendation also defines an alternative rule called evenodd rule. If we applied this rule, the pentagonal area in the center of this Polygon would be considered outside:
Visual Center
Let \(n\) be the number of Points, and let \(x_i\) and \(y_i\) be the X and Y positions of Point \(i\) for \(0 \leq i < n\).
Then the horizontal position \(c_x\) and the vertical position \(c_y\) of the visual center of the Polygon are
Intuitively, the visual center is the center of the minimum bounding box that contains all Points.
If the Polygon has the FillStyle Hatch, then one of the hatch lines will cross through the visual center.
Example
For the Polygon above, we have
and
Mapping to SVG
A Polygon corresponds to an svg:polygon with these attributes:
transformcontains a translation from the origin to the visual center. This is required due to the modified positions inpoints.transform = "translate(+ str(\(c_x\)) +,+ str(\(c_y\)) +)"pointscontains the Points of the Polygon relative to the visual center.For each Point \(i\) with (absolute) position \(x_i\) and \(y_i\), the position relative to the visual center is
\[ \begin{align}\begin{aligned}\tilde{x}_i &= x_i - c_x \quad ,\\\tilde{y}_i &= y_i - c_y \quad .\end{aligned}\end{align} \]Each of the relative positions is converted to a string as str(\(\tilde{x}_i\)) +
,+ str(\(\tilde{y}_i\)). Finally, thepointsattribute is set to a single string that contains all relative positions, separated by spaces.stroke,stroke-dasharray,stroke-dashoffsetandstroke-widthare set according to the SVG mapping rules for the Stroke of the Polygon (see Stroke).stroke-linecap = "round"andstroke-linejoin = "round"reflect the heuristic for line caps and line joins.vector-effect = "non-scaling-stroke"reflects the heuristic for scaled symbols.fillis set according to the SVG mapping rules for the FillStyle of the Polygon (see FillStyle).
Example
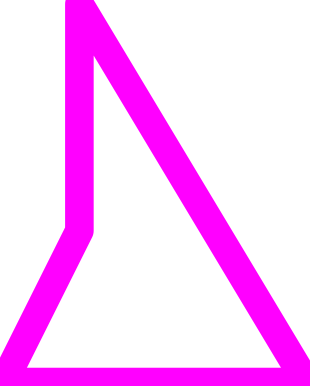
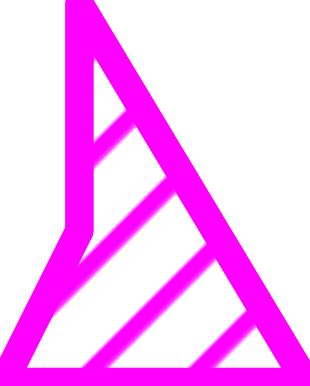
We assume that the Stroke of the Polygon above is
2mm #ff00ff Solid and that its FillStyle is
Transparent.
{PolygonTransparentSvgCode}

FillStyle
Data Property
The fill style of the Polygon.
Type: FillStyle
Multiplicity: 1
Ordered: no
Unique: no
Example
Points
Data Property
The points (vertices) of the Polygon.
Type: Point
Multiplicity: 3..*
Ordered: yes
Unique: no
Example
[
X = 3.5,
Y = 5.5),
X = 5.5,
Y = 7.5),
X = 1.5,
Y = 9.5)
]
Stroke
Data Property
The stroke of the Polygon.
Type: Stroke
Multiplicity: 1
Ordered: no
Unique: no
Example
B = 0,
G = 0,
R = 128),
Width = 0.3)
Example in DEXPI XML
<Object type="Core/Diagram.Polygon">
  <Data property="FillStyle">
    <DataReference data="Core/Diagram.FillStyle.Transparent"/>
  </Data>
  <Data property="Points">
    <AggregatedDataValue type="Core/Diagram.Point">
      <Data property="X">
        <Double>3.5</Double>
      </Data>
      <Data property="Y">
        <Double>5.5</Double>
      </Data>
    </AggregatedDataValue>
    <AggregatedDataValue type="Core/Diagram.Point">
      <Data property="X">
        <Double>5.5</Double>
      </Data>
      <Data property="Y">
        <Double>7.5</Double>
      </Data>
    </AggregatedDataValue>
    <AggregatedDataValue type="Core/Diagram.Point">
      <Data property="X">
        <Double>1.5</Double>
      </Data>
      <Data property="Y">
        <Double>9.5</Double>
      </Data>
    </AggregatedDataValue>
  </Data>
  <Data property="Stroke">
    <AggregatedDataValue type="Core/Diagram.Stroke">
      <Data property="Color">
        <AggregatedDataValue type="Core/Diagram.Color">
          <Data property="B">
            <Integer>0</Integer>
          </Data>
          <Data property="G">
            <Integer>0</Integer>
          </Data>
          <Data property="R">
            <Integer>128</Integer>
          </Data>
        </AggregatedDataValue>
      </Data>
      <Data property="DashStyle">
        <DataReference data="Core/Diagram.DashStyle.Solid"/>
      </Data>
      <Data property="Width">
        <Double>0.3</Double>
      </Data>
    </AggregatedDataValue>
  </Data>
</Object>